![EV New logo_2021_Dark BG.svg]](https://knowledgebase.ev.uk/hubfs/EV%20Logos%202021/EV%20New%20logo_2021_Dark%20BG.svg)
The Sustainable Expenses calculator will provide a figure that the client can sustainable spend in retirement, so that at mortality they have little to no money/liquid assets left.
An example has been used to help explain how the calculator works.
We use 3 outcomes in our Cashflow Potential journey graphs – weak (95%), average
(50%) and strong (5%) so let’s look at what happens with these percentages.
To see the effect when looking at a weak outcome on the Plan comparison page, use the 95% amount here in 'Target likelihood':
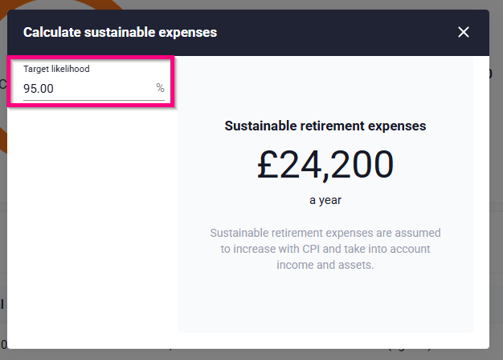
In this example the amount that the client can afford sustainable is £24,200.
Once the client's retirement expenses have been updated to this figure and the Cashflow has been run, navigate to Potential journey > Assets . The client did run out of money at Mortality (age 95) when looking at a weak outcome: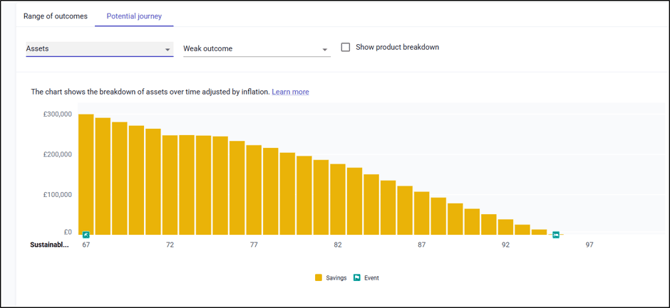
In this next example, we've added a 50% likelihood figure (for the Average outcome) and have updated the clients retirement expenses to £28,200.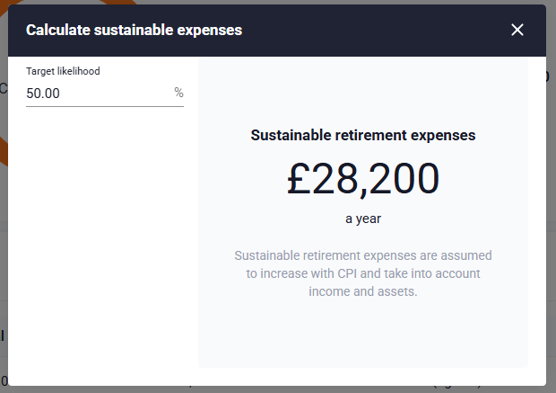
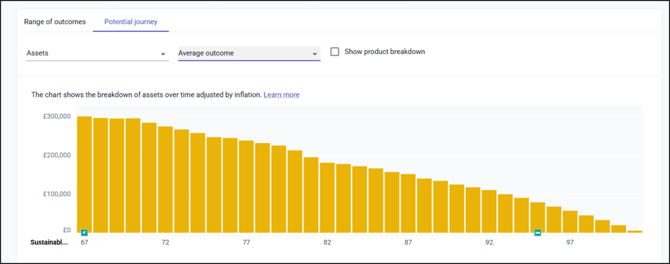
When looking at Potential journey > Assets using the Average outcome, the assets run out totally the year after Mortality (there was £10,000 left):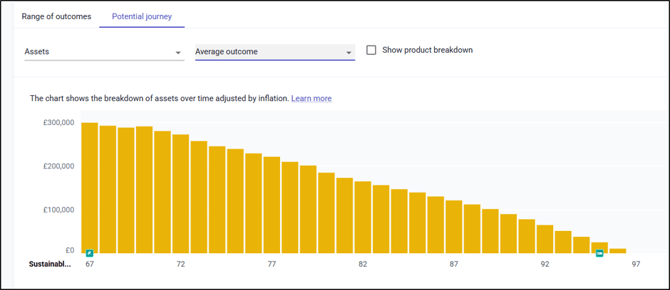
Finally, Ito see this with a strong outcome, we updated the 'Target likelihood' to 5% and the sustainable expenses figure is £32,800.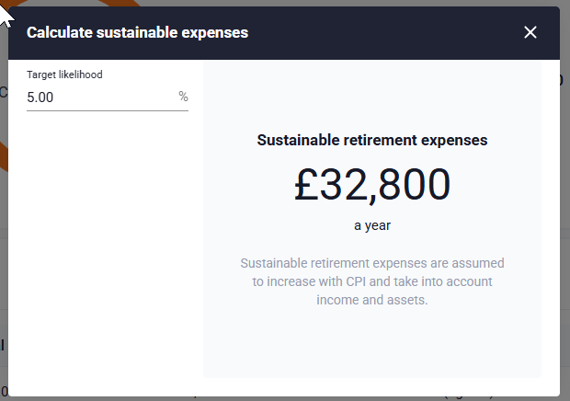
Having changed the clients retirement expenses to this figure, ran the cashflow and looked at the Assets using the Strong outcome and with this one, the money runs out early as we only said we want only 5% likelihood of lasting until Mortality: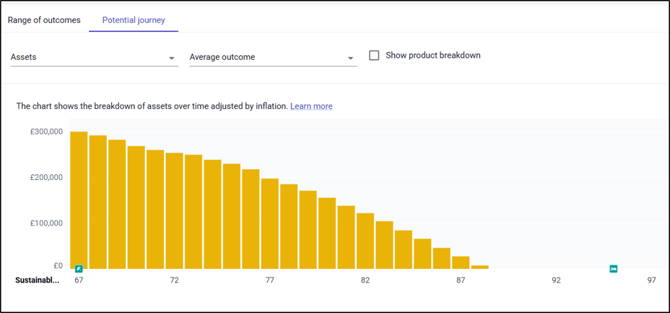
When using a 75% target likelihood, and viewing the Assets in the cashflow, they do look to last longer and that’s because we don’t give an option to view this scenario (75%) so when viewing with the average outcome (50%), the money will last longer as the income is lower (in this example is was £26,300).