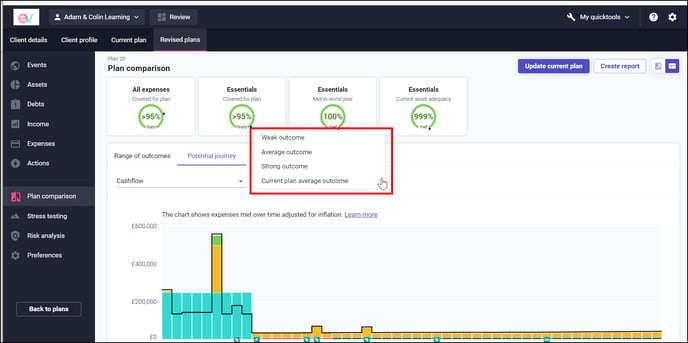
On the Potential journey graph, in Plan Overview, we select 3 scenarios to demonstrate a potential cashflow journey out of the 1000 scenarios that are run. The average outcome is the scenario that when put in order from worst to best had the median (middle) amount of money left at plan end date.
When you carry out a Revised plan, in order that you can compare to your current plan on a like for like basis, you have the option in Plan comparison when viewing the charts, to select “current plan average outcome” from the dropdown on potential journey.

By selecting this, the same scenario that was used in the current plan is used to demonstrate a potential journey within Plan comparison.