Technical explanation:
We start by working out the level of expenses that are met by income or assets in a year divided by the target expenses for that year.
We do this for every year and for each of the forecast 1,000 scenarios. The 1,000 scenarios for each year are ordered from highest to lowest, and we look at the bottom 5th percentile result, ie the 50th out of the 1,000 results.
We compare this 5th percentile figure across every year in the plan up to the end age to find the lowest proportion across the plan term. This measures the potential downside for clients should their assets run out early.
Client friendly explanation:
"This figure is the worst proportion of the lifestyle you might experience if markets are very poor and returns are much lower than expected, at any point in the plan. If this is at the ideal level of 100% it means that your lifestyle won’t be affected by market fluctuations."
Let’s explain using some examples:
Example 1 - This client has a figure of 100%.
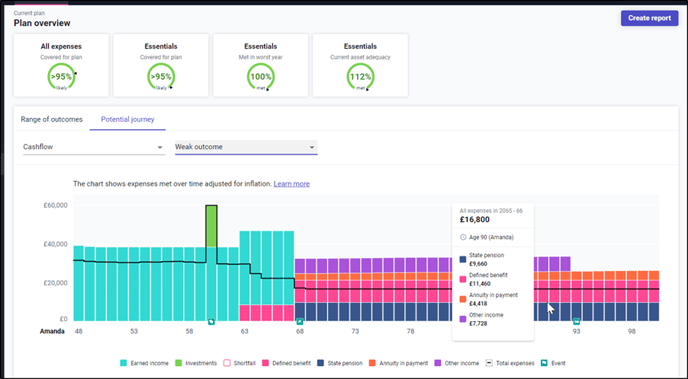
After changing the Potential journey to the 'Weak outcome', you can see that for each year there is no shortfall. What this means is that in every year of the plan, the stochastic model says that the client will be able to cover all of their essential expenses.
In this example the client only has essential expenses.
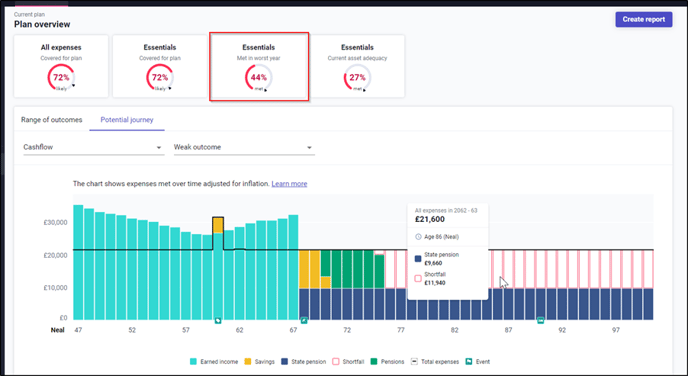
Example 2 - This client has a figure of 44%.
After changing the Potential journey to the 'Weak outcome', you can see that for each year after the age of 74 there is a shortfall. The figures confirms that the clients expenses are £21,600. But the state pension is £9,660, which gives a shortfall of £11,940.
This means that currently, the income the client has will only cover 44% of their essential expenses.
In this example the client only has essential expenses.
Note that the graph shows total expenses so will include desirables in the cash flow shown, but the essentials met in worst year figure only looks at essential expenses. Therefore you may have a situation where the chart is showing a shortfall but the essentials met is still 100%, because essentials are met even where desirables are not.